The Shape of Water - Flow without a Flowmeter
The idea of knowing the flowrates at a lift station makes engineers and utility managers giddy with excitement. The insight that it can offer into how the station is operating and how the system is changing is invaluable. However, from a capital and maintenance perspective, flowmeters at lift stations are a nightmare. They are expensive, difficult to maintain, and can easily clog leading to erroneous readings.
Control experts have talked about finding a way to compute the flow rate using some other trend such as the level in the wet well. Theoretically assuming a prismatic wet well, the rate of change level is proportional to the net flow in or out of the wet well. Many have attempted to calculate lift station flows based on these assumptions about the shape of the wet well. However, such assumptions are not without their consequences. Pumps, pipes, cables, inlets and other equipment can dramatically impact the storage characteristics of the wet well. To accurately calculate flow without a flowmeter, one must account for all the nuances in the “shape” of the wet well.
Creating a strapping table
To characterize the shape of the lift station, we are going to build up what is called a strapping table. This is simply a data table or function that associates level in a tank to the volume (or unit volume) at that level. If we manage to build up a good strapping table, we can accurately associate any change in level with a change in volume (which gives us a flow rate). Instead of meticulously measure pipes and pumps to determine their contribution to the volume of the wet well, we are going to look at level data in a wet well to create our strapping table. The figure below depicts a typical historical trend for the level in a lift station.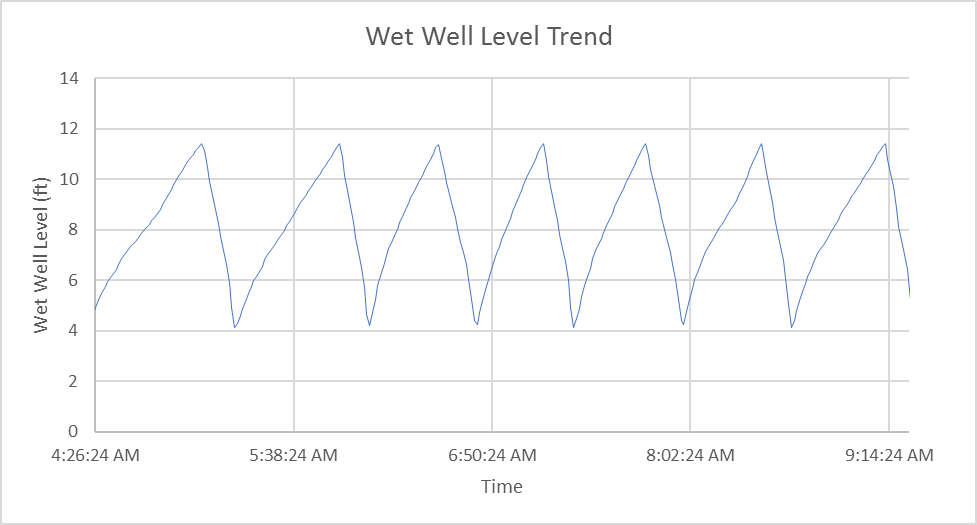
Our goal here is to find the patterns in these fill cycles and use it to build an accurate strapping table. To do this we are going to start by looking at an individual fill cycle, assuming a constant inflow, and integrating the level to get a unit volume relationship for this fill cycle. Below is what we get for one fill cycle.
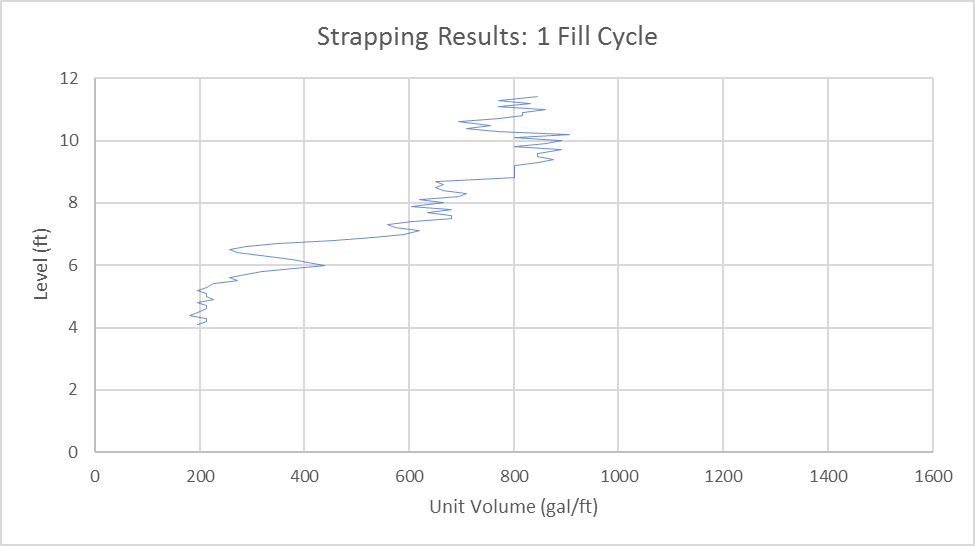
The above relationship is the level vs. unit volume relationship of our lift station according to one fill cycle. However, since we assumed constant inflow, this assumption needs to be averaged out. The Law of Large Numbers dictates that for enough samples of the same process (in this case, fill cycles), the average of all the samples will approach the expected value. Therefore, we need to repeat the above process many times, and the shape of the wet well will start to emerge. Below are the strapping results for 4 weeks of operation. This equates to 850 fill cycles and 4.2 million data points.
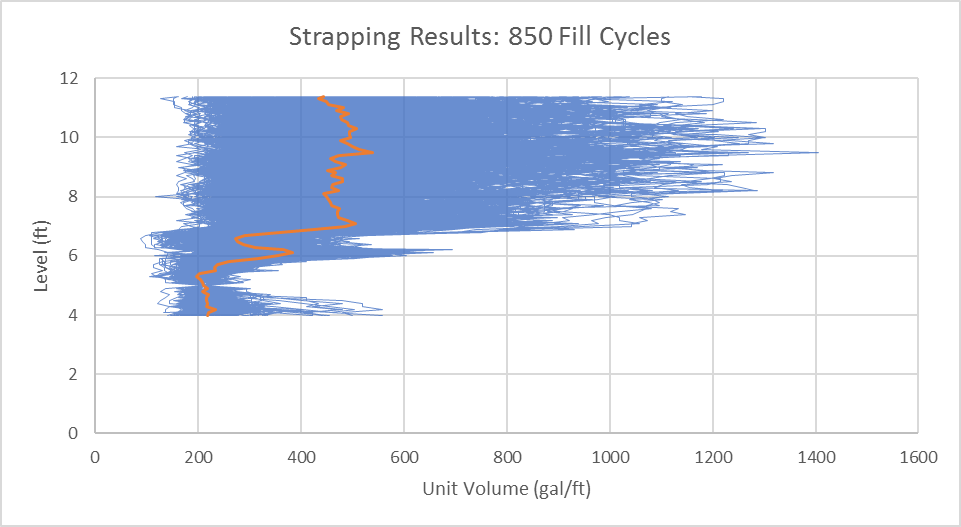
The orange line represents the average of all 850 fill cycles. The shape that emerges here looks hard to believe at first glance. To confirm our results, we can run the same algorithm on an independent set of data from the same lift station. We will essentially shift our data window by four weeks and see if the results are at all consistent. The comparison of our two tests is shown below:
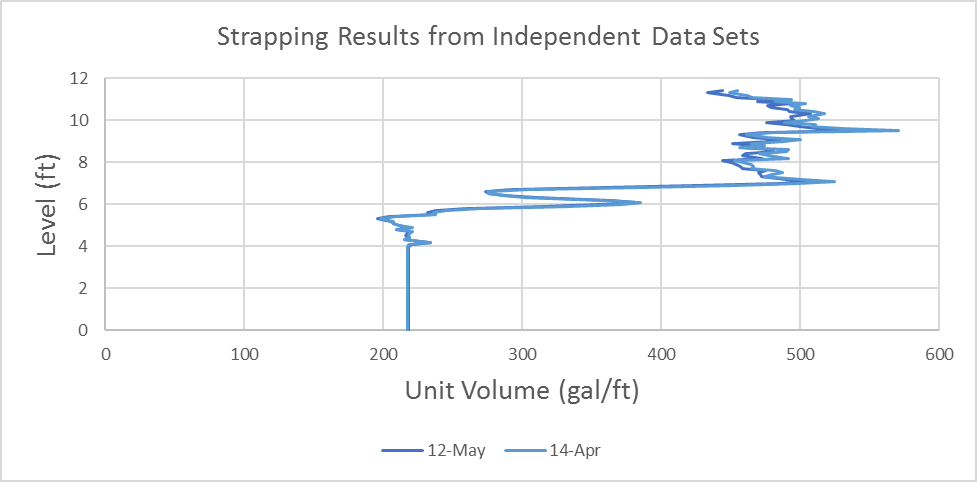
The results are repeatable, and it is at this point that we realize the assumption of a prismatic wet well is woefully misguided. When we overlay this strapping curve on the plans for this lift station, some interesting correlations emerge.
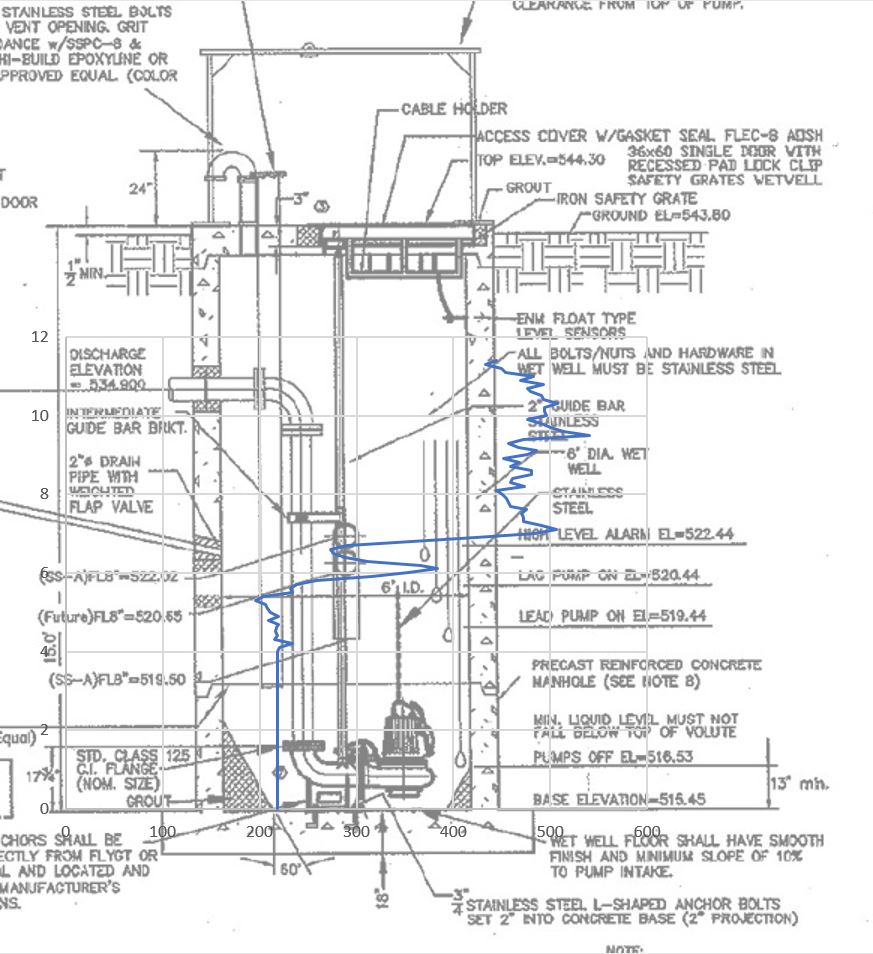
We can see that the dramatic increase in storage volume that we see at around 7 feet is due to the influent pipe being submerged. Additionally, just below the inflow pipe is a stub-out pipe that gives a momentary bump in storage capacity.
Now that we have a strapping table that we are confident in, we can perform a similar algorithm on the pumps to characterize their flows at a function of level. Using just a level sensor, we have been able to compute the flows in and out of the lift station. Flows at a lift station are the keys to some incredibly practical tools that have often been foregone at lift stations. With flow we can track pump health, monitor where pumps operate on their pump curves, and characterize INI and development growth. This only scratches the surface of what is capable when we look past the lines on the graph and attempt to tease information out of the data.