The Importance of Pump Testing
Pumps are expensive tools and keeping them running is one of the biggest operational expenditures for many utilities. Despite this, the only one who usually sees a given pump’s performance curves and knows how it is supposed to operate is the design engineer who selected it. System integrators and operators are left out of the loop and treat pumps as interchangeable black boxes: you put in power and you get out water.
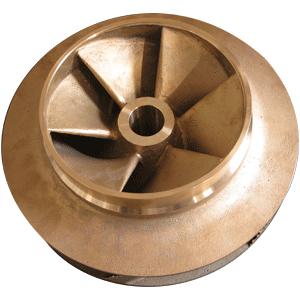
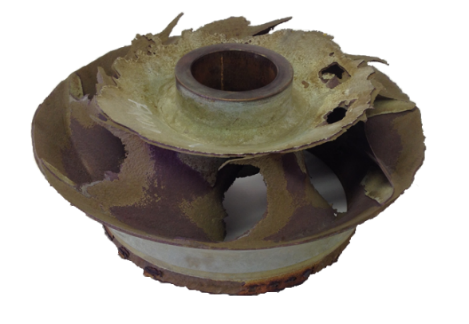
This is a bad standard. It’s nearly impossible to control a pump correctly if you don’t know how it is meant to run or where it is operating. As time passes, the odds of doing the right thing get even lower as system conditions change, demands fluctuate, and the pump begins to wear. And make no mistake, the pump will wear. Like your car’s tires, even properly operated and maintained pumps erode, losing capacity and efficiency over time. If you don’t know how to operate the pump when it is brand new, you aren’t going to operate it correctly when it begins to wear. Below is a visual comparison of a new, unused pump impeller to a pump impeller that had been in service beyond its useful life.
Pump testing infrequently
Some pump owners do periodically test their pumps try to see what state each pump is in. Usually, an engineering firm will be hired to visit a site and perform a one-off test on each pump. These tests are extremely infrequent, however, and only the largest sites are tested at all. When the tests are run, the resultant reports only show the pumps may be worn and leave it at that. There’s little to no critical feedback or recommendations provided to the owner. The report is put on a shelf to gather dust and the pump station’s operation remains unchanged.
Knowing pump health is essential and can fundamentally change how a pump station is managed. Worn pump curves often bear little resemblance to their factory new curves. Older pumps are an enigma and a reliability concern that no manager can quantify. Usually these pumps are pulled and repaired when they start producing little to no flow during normal operation. This is called “running to failure” and is a huge liability.
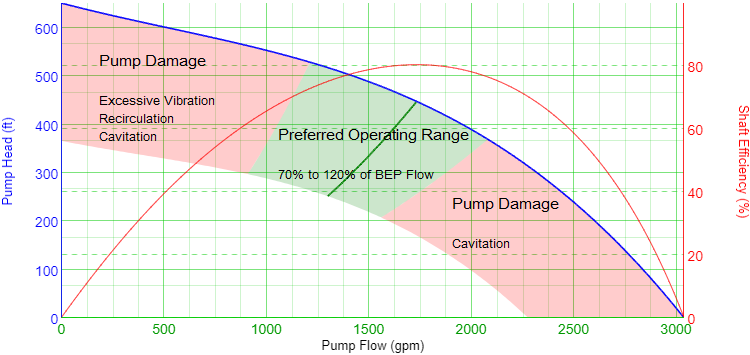
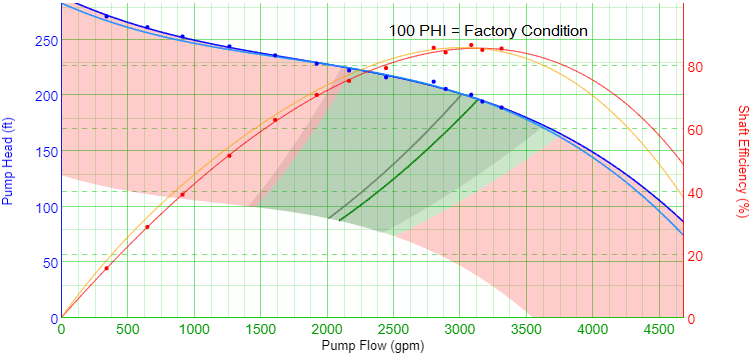
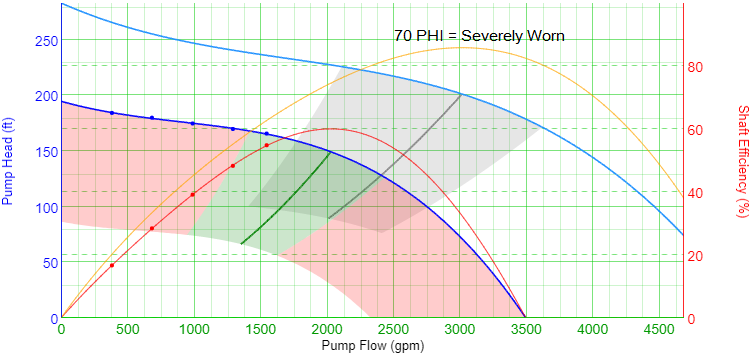
Above is a typical pump head curve (blue) and pump efficiency curve (red). These define the shaded green region called the Preferred Operating Range (POR). The POR is defined by pump manufacturers as 70% - 120% of a pump’s Best Efficiency Point (BEP) flow. While operating within POR, pumps run as designed and avoid recirculation and cavitation that accelerate pump wear. Operating within POR maintains a pump’s useful life as long as possible. The red regions show the areas of possible operation for this pump outside of POR.
By running a pump through its paces and acquiring a bunch of different operating points, a tested pump curve can be generated. If the pump is on a VFD, performing a pump test is pretty straightforward. You measure pump flow, head, and power at a bunch of different pump speeds. If the pump only has a flow meter common to the station, the other pumps will have to be turned off. Using the affinity laws, these can be scaled up to calculate the full speed operation curves. For more detailed discussion on pump curves and the affinity laws, check out the Affinity Law Discussion here.
How to know a pump is past its lifespan
Unfortunately, many pumps stay in operation well past their useful life without anyone noticing the pump’s performance has significantly fallen off. Here’s a real life example: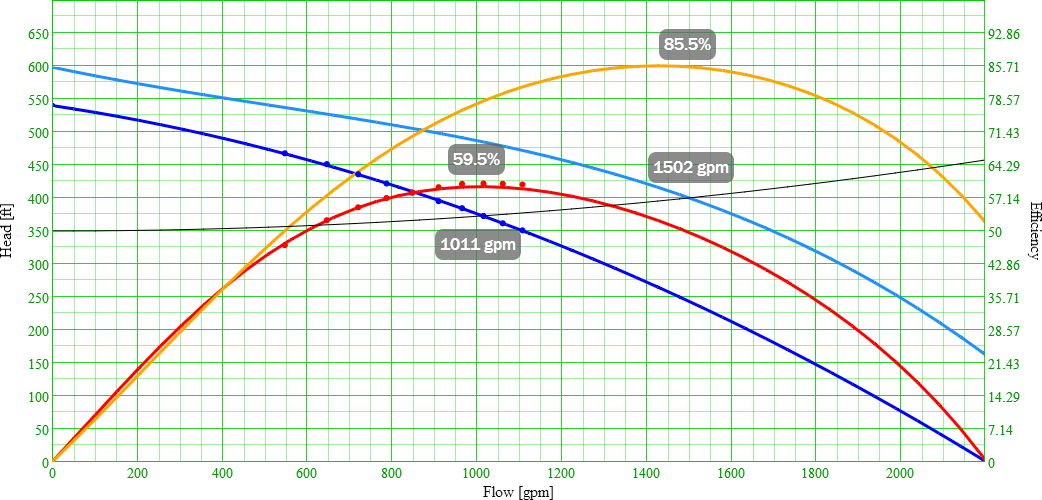
This graph shows the tested pump head curve (dark blue) and the tested pump efficiency curve (red). The recorded test points have been scaled to full speed and are shown as dots. The factory head and efficiency curves are plotted in light blue and gold for comparison. This pump suffered a 32.6% capacity reduction and a 30.6% efficiency reduction and still remained in service. This means the pump was producing a lot less water than it used to and was using a lot more energy to do it. This pump was one of five pumps at its pump station and, before testing, the operators had no idea the pump was so worn.
Even within a pump station, the amount of wear between pumps can be drastically different. To help characterize this, we use a term called Pump Health Index (PHI). PHI is simply defined as the ratio of peak tested efficiency to peak factory efficiency.
Above is a comparison of actual tested pump curves for two pumps at a pump station against their factory curves. The factory POR is shown as a gray area on both graphs for comparison. Despite these tests being conducted within hours of each other, the PHIs of each pump are drastically different and reflect the two pumps drastically different states of wear. Before testing, the pumps were treated as ‘identical’ at the pump station.
By tracking these curves and recording flow, head, and pressure, we can track where a pump is operating along its tested pump curve and make sure it is operating in POR to keep it healthy as long as possible.
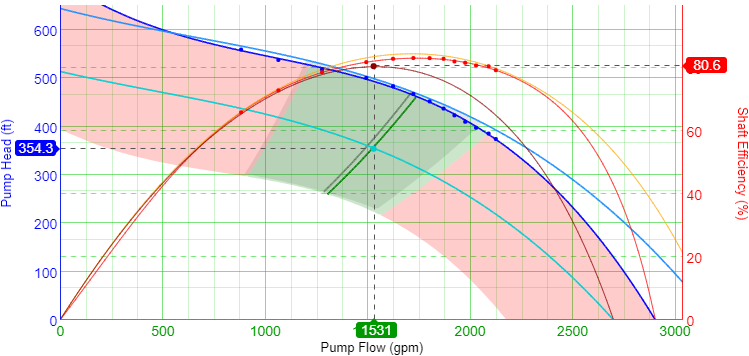
The pump test curve (blue) is shown against the factory curve (light blue). Current efficiency curve (red) is shown against the factory efficiency curve (gold). This pump was running at 52.5 Hz, so the scaled head and efficiency curves are shown in cyan and brown. This pump is operating right along its line of best efficiency.
Pump tests can also use to validate new pumps or pump repairs. A pump could be machined imperfectly, the pump could be mounted incorrectly, or it could simply be the wrong impeller in the pump. In any case, testing pumps allows utilities to ensure they have gotten what they have paid for:
In the real example above, the test data shows that the brand new pump was performing well beneath the factory performance curve. Often the only validation a pump supplier will do is to shut a discharge valve so the pump runs at zero flow and check pump head and motor current. In this case, that matches well, but doesn’t come close to telling the full story of the pump.
Pump testing is the only way to really know what state your pumping assets are in. Whether the pumps are factory new or have been in service for 15 years, only testing will really tell you the state of each pump and how much you can rely on it. By testing all the pumps in your pump station, you can also determine the real capacity of your pump station to determine what flows and pressures you can and cannot meet. Finally, testing pumps allow you to see which pumps cannot contribute and are a target for replacement.